Support for the iotlab-m3 board. More...
Detailed Description
Support for the iotlab-m3 board.
Components
| MCU | ST2M32F103REY – 32-bits, 64KiB RAM |
|---|---|
| sensors | Light (ISL29020) |
| Pressure (LPS331AP) | |
| Tri-axis accelerometer/magnetometer (LSM303DLHC) | |
| Tri-axis gyrometer (L3G4200D) | |
| external memory | 128 Mbits external Nor flash (N25Q128A13E1240F) |
| power | 3,7V LiPo battery – 650 mAh (063040) |
| radio chipset | AT86RF231 |
| a IEEE802.15.4-compliant radio at 2.4 GHz |
Board HW overview

Board Architecture

Board schematics
, wiring, pinouts, etc...
Implementation Status
| Device | ID | Supported | Comments |
|---|---|---|---|
| MCU | STM32F103REY | partly | Energy saving modes not fully utilized |
| Low-level driver | GPIO | yes | |
| PWM | no | periph config missing | |
| UART | yes | ||
| I2C | yes | ||
| SPI | yes | ||
| USB | no | ||
| RTT | yes | ||
| Timer | yes | ||
| Radio Chip | AT86RF231 | yes | |
| Accelerometer | LSM303DLHC | yes | |
| Magnetometer | LSM303DLHC | yes | |
| Gyroscope | L3G4200D | yes | |
| Pressure Sensor | LPS331AP | yes | |
| Light Sensor | ISL29020 | yes | |
| SPI Flash | N25Q128 | yes |
Toolchains
See ARM Family
Working:
Programming and Debugging
In order to program (flash) and debug the node you need OpenOCD and an ARM version of gdb (arm-none- eabi-gdb), which provided by most toolchains. Most Linux distributions provide also a package for OpenOCD. The required configuration files are provided by RIOT. When starting the debugger with make debug BOARD=iotlab-m3 GDB connects to openocd, loads the elf-file and puts the MCU into halt state. Before setting breakpoints it is sometimes needed to use the following workflow
For best debugging experience also change the -Os flag in Makefile.include's CFLAGS variable to -O0.
Details
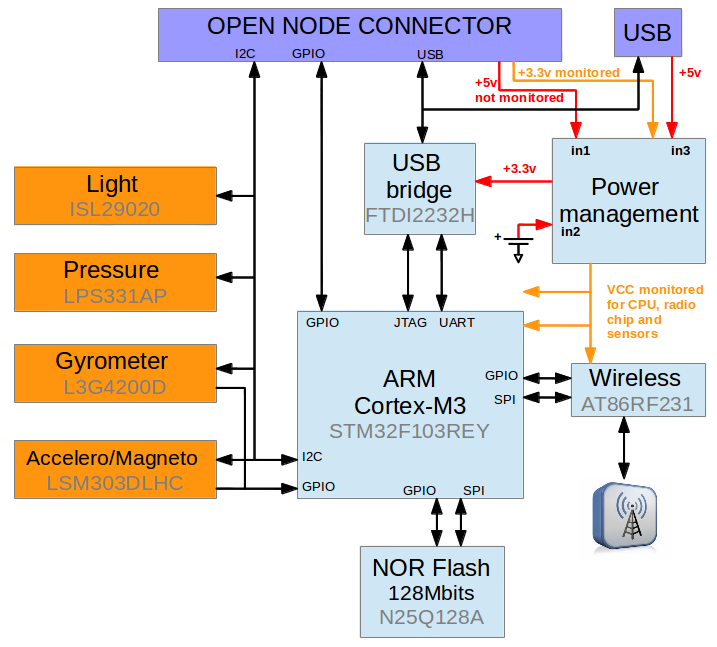
The M3 Open Node can reset, debug and program the STM32 on JTAG through the FTDI2322H connected to the USB. This component allows also a UART link to the STM32. The Open Node connector gives access to 3 STM32/GPIO and the STM32/I2C. Two power lines are accessible on this connector:
- a + 5.0 volts for the board power supply
- a 3.3 volts for the consumption monitoring of the STM32, the RF component and the sensors
The M3 Open Node can be used standalone without a gateway connected to the M3 Open node connector. The powering of the board is then assumed by a battery or by the USB connector The choice of the power input is done electronically (power management).

Debugging
For debugging you need to open a terminal. Here you simply have to call make debug - assuming that the current directory is your application directory. It establishes an openocd connection to the device and starts gdb connected to the openocd instance. For example, it should look something like this
The node will reboot and you can continue to use gdb like you're used to. In some cases it seems necessary to prepend a monitor reset run before executing continue. In general you can use openocd commands prepended by monitor. In the case the node crashes it can be reset with the following sequence
Troubleshooting
For terminal output on macOS (make term) you need to install a driver: http://www.ftdichip.com/Drivers/VCP.htm http://www.ftdichip.com/Drivers/VCP.htm
Files | |
| file | board.h |
| Board specific definitions for the iotlab-m3 board. | |
| file | periph_conf.h |
| Peripheral MCU configuration for the iotlab-m3 board. | |